 eGig

SMIT PATEL
Aspiring Data analyst | MIS Executive | Back Office operator ·
Hire
Auto Loan Securitisation Analytics
Project Overview
This project presents an end-to-end analytics framework for an Auto Loan Securitisation Portfolio, developed using Microsoft Power BI, DAX and Excel.
The solution integrates portfolio, delinquency, vintage, credit-risk, ECL, waterfall, stress-testing and investor-reporting analytics into a single reporting… Auto Loan Securitisation Analytics
Project Overview
This project presents an end-to-end analytics framework for an Auto Loan Securitisation Portfolio, developed using Microsoft Power BI, DAX and Excel.
The solution integrates portfolio, delinquency, vintage, credit-risk, ECL, waterfall, stress-testing and investor-reporting analytics into a single reporting framework.
The objective is to provide a structured and repeatable approach for monitoring portfolio performance, credit risk, transaction cash flows and reporting requirements.
Key Technologies
Power BI – Data modelling, dashboards and interactive reporting
DAX – Financial, portfolio and risk calculations
Power Query – Data preparation and transformation
Microsoft Excel – Independent ECL and waterfall validation
Row-Level Security (RLS) – Regional data access control
Data Sources
The project uses four primary datasets:
Auto Loan Securitisation Data
Loan characteristics
Borrower information
Vehicle information
Current balances
Credit-risk fields
ECL fields
DPD Snapshot History
Delinquency days
DPD buckets
Cure and roll flags
Repossession and write-off indicators
Dynamic Monthly Performance
Monthly balances
Defaults
Losses
Recoveries
Prepayments
Collections
Collection efficiency
Static Pool / Vintage Data
Vintage performance
Cumulative defaults
Gross and net losses
Recoveries
Pool factor
Marginal loss rates
Data Model
A star-schema architecture was implemented in Power BI.
Dimension Tables
DimLoan
DimBorrower
DimVehicle
DimGeography
DimDate
DimDPDBucket
Fact Tables
FactMonthlyPerformance
FactDPDSnapshot
FactDynamicLoss
FactStaticPool
This structure supports consistent filtering, calculations and portfolio analysis.
Power BI Dashboard Pages
The final Power BI solution contains 10 interactive dashboard pages:
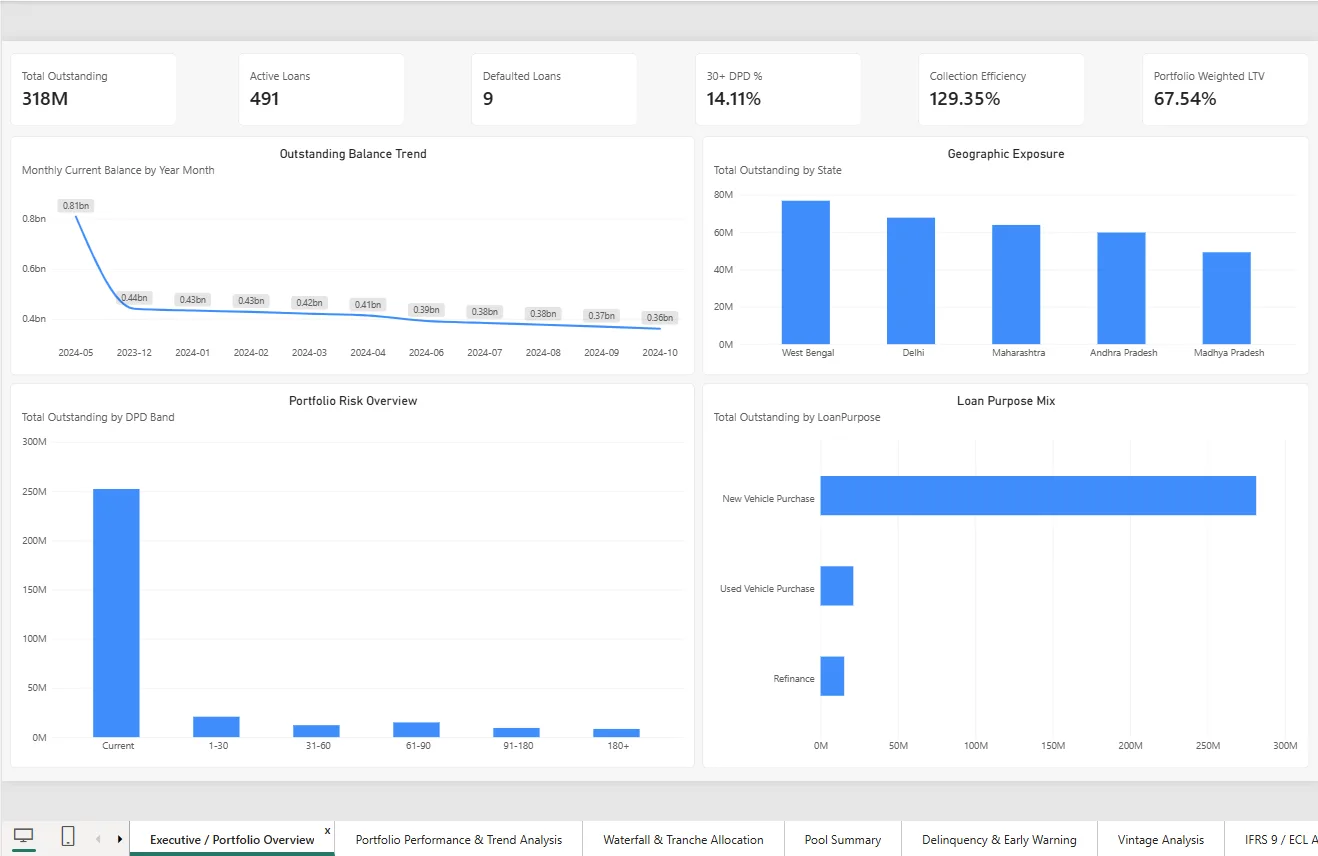
1. Executive / Portfolio Overview
Provides a high-level view of portfolio size, balances, loan activity and key risk indicators.
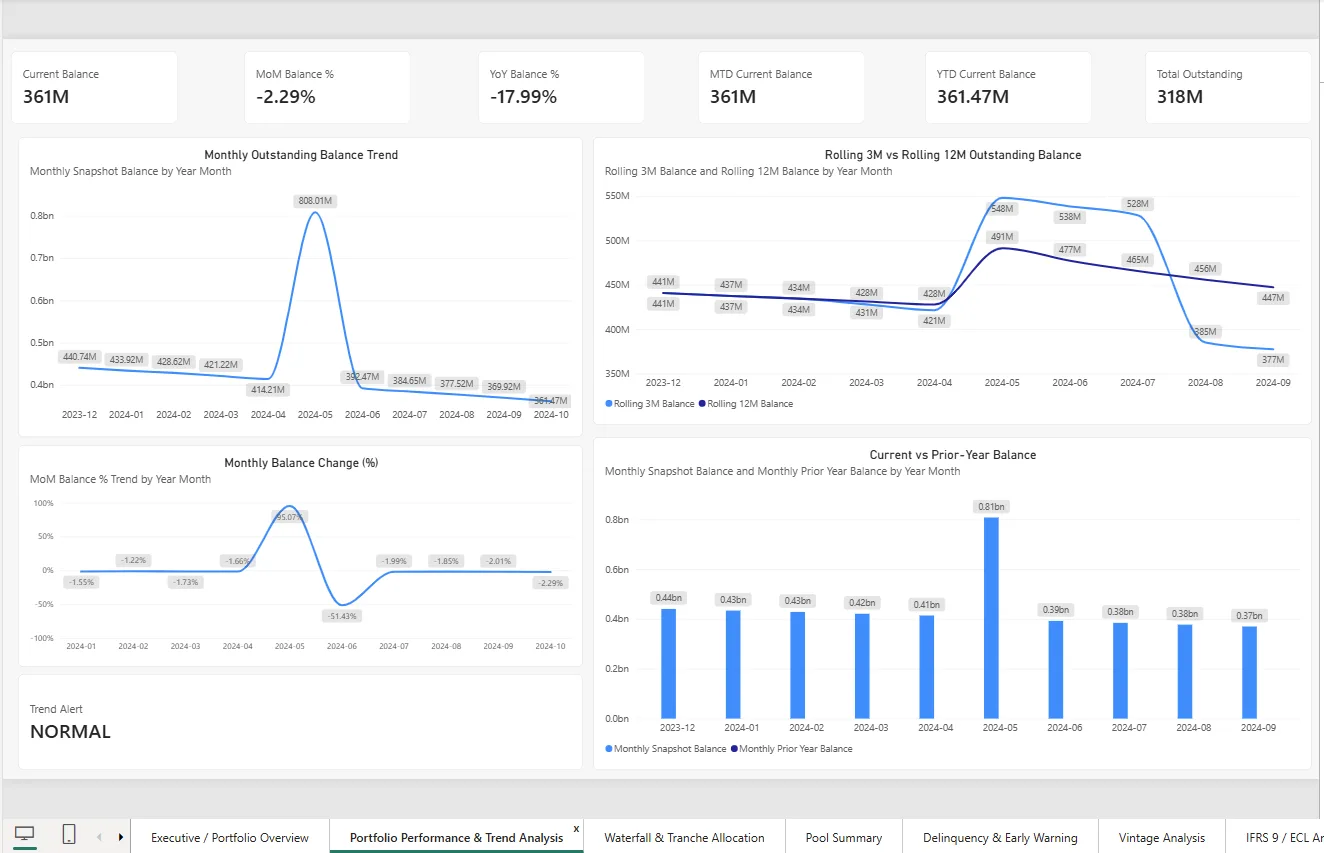
2. Time & Portfolio Performance
Includes MTD, QTD, YTD, MoM, YoY and rolling portfolio performance analysis.
3. Waterfall & Tranche Allocation
Analyses collections, senior and mezzanine allocations, equity residuals, OC/IC ratios, reserves and transaction triggers.
4. Pool Summary
Provides portfolio-level balance, loan count and pool characteristic analysis.
5. Delinquency & Early Warning
Monitors current, 30+, 60+ and 90+ DPD, delinquency trends, DPD distribution and trigger indicators.
6. Vintage Analysis
Analyses portfolio performance by vintage and months-on-book, including cumulative losses and marginal loss rates.
7. IFRS 9 / ECL
Calculates and analyses Expected Credit Loss using PD, LGD and EAD, including Stage 1, Stage 2 and Stage 3 analysis.
8. Stress Testing & What-If
Evaluates portfolio sensitivity under different default, recovery, prepayment and interest-rate assumptions.
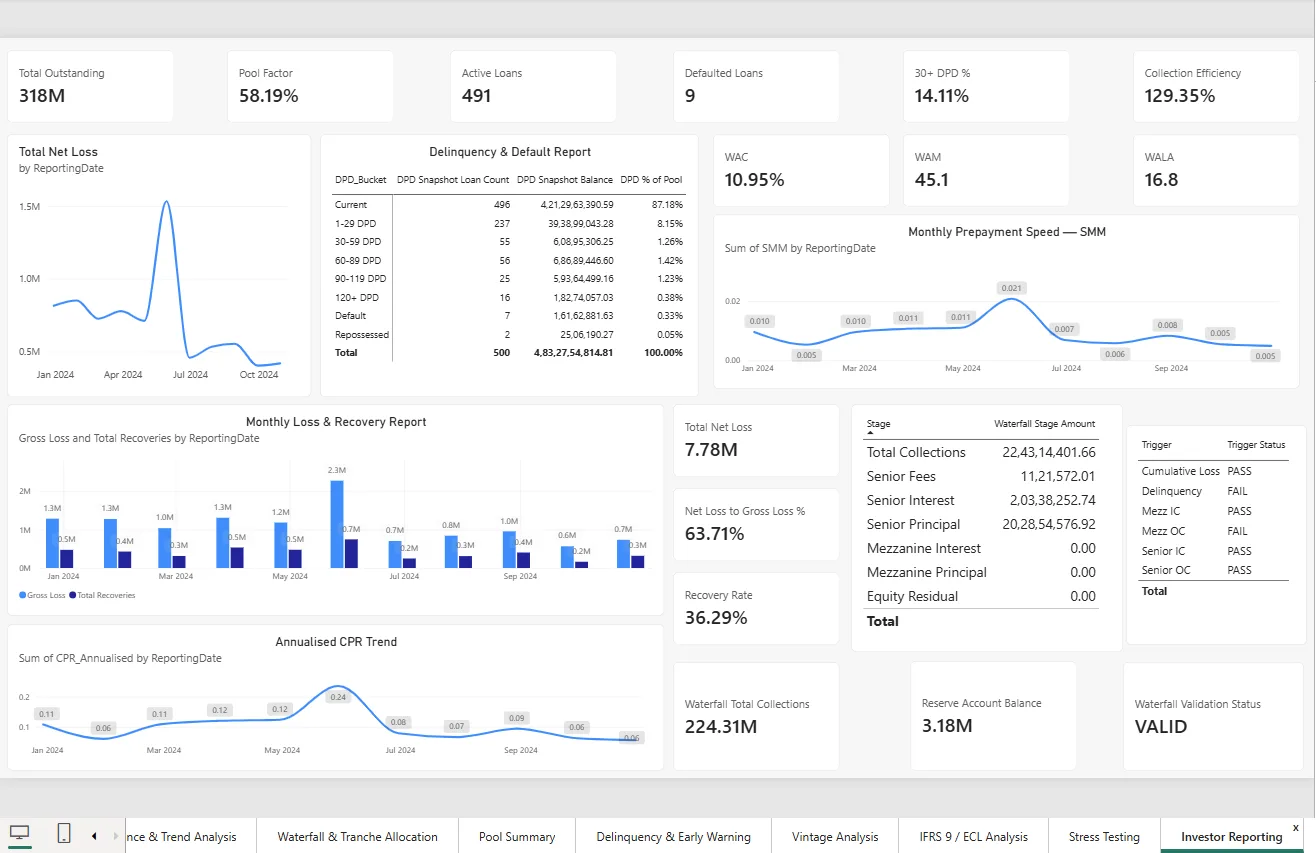
9. Investor Reporting
Provides six reporting sections:
Pool Summary
Delinquency Report
Loss & Recovery Report
Prepayment Report
Waterfall Report
Trigger Status
10.
Project Overview
This project presents an end-to-end analytics framework for an Auto Loan Securitisation Portfolio, developed using Microsoft Power BI, DAX and Excel.
The solution integrates portfolio, delinquency, vintage, credit-risk, ECL, waterfall, stress-testing and investor-reporting analytics into a single reporting… Auto Loan Securitisation Analytics
Project Overview
This project presents an end-to-end analytics framework for an Auto Loan Securitisation Portfolio, developed using Microsoft Power BI, DAX and Excel.
The solution integrates portfolio, delinquency, vintage, credit-risk, ECL, waterfall, stress-testing and investor-reporting analytics into a single reporting framework.
The objective is to provide a structured and repeatable approach for monitoring portfolio performance, credit risk, transaction cash flows and reporting requirements.
Key Technologies
Power BI – Data modelling, dashboards and interactive reporting
DAX – Financial, portfolio and risk calculations
Power Query – Data preparation and transformation
Microsoft Excel – Independent ECL and waterfall validation
Row-Level Security (RLS) – Regional data access control
Data Sources
The project uses four primary datasets:
Auto Loan Securitisation Data
Loan characteristics
Borrower information
Vehicle information
Current balances
Credit-risk fields
ECL fields
DPD Snapshot History
Delinquency days
DPD buckets
Cure and roll flags
Repossession and write-off indicators
Dynamic Monthly Performance
Monthly balances
Defaults
Losses
Recoveries
Prepayments
Collections
Collection efficiency
Static Pool / Vintage Data
Vintage performance
Cumulative defaults
Gross and net losses
Recoveries
Pool factor
Marginal loss rates
Data Model
A star-schema architecture was implemented in Power BI.
Dimension Tables
DimLoan
DimBorrower
DimVehicle
DimGeography
DimDate
DimDPDBucket
Fact Tables
FactMonthlyPerformance
FactDPDSnapshot
FactDynamicLoss
FactStaticPool
This structure supports consistent filtering, calculations and portfolio analysis.
Power BI Dashboard Pages
The final Power BI solution contains 10 interactive dashboard pages:
1. Executive / Portfolio Overview
Provides a high-level view of portfolio size, balances, loan activity and key risk indicators.
2. Time & Portfolio Performance
Includes MTD, QTD, YTD, MoM, YoY and rolling portfolio performance analysis.
3. Waterfall & Tranche Allocation
Analyses collections, senior and mezzanine allocations, equity residuals, OC/IC ratios, reserves and transaction triggers.
4. Pool Summary
Provides portfolio-level balance, loan count and pool characteristic analysis.
5. Delinquency & Early Warning
Monitors current, 30+, 60+ and 90+ DPD, delinquency trends, DPD distribution and trigger indicators.
6. Vintage Analysis
Analyses portfolio performance by vintage and months-on-book, including cumulative losses and marginal loss rates.
7. IFRS 9 / ECL
Calculates and analyses Expected Credit Loss using PD, LGD and EAD, including Stage 1, Stage 2 and Stage 3 analysis.
8. Stress Testing & What-If
Evaluates portfolio sensitivity under different default, recovery, prepayment and interest-rate assumptions.
9. Investor Reporting
Provides six reporting sections:
Pool Summary
Delinquency Report
Loss & Recovery Report
Prepayment Report
Waterfall Report
Trigger Status
10.
Comments
Log in to comment.