eGig

Niraj Sikotariya
Stock market research, Data entry operator,
5-Year Financial Analysis of Tata Consultancy Services (TCS) Using Excel
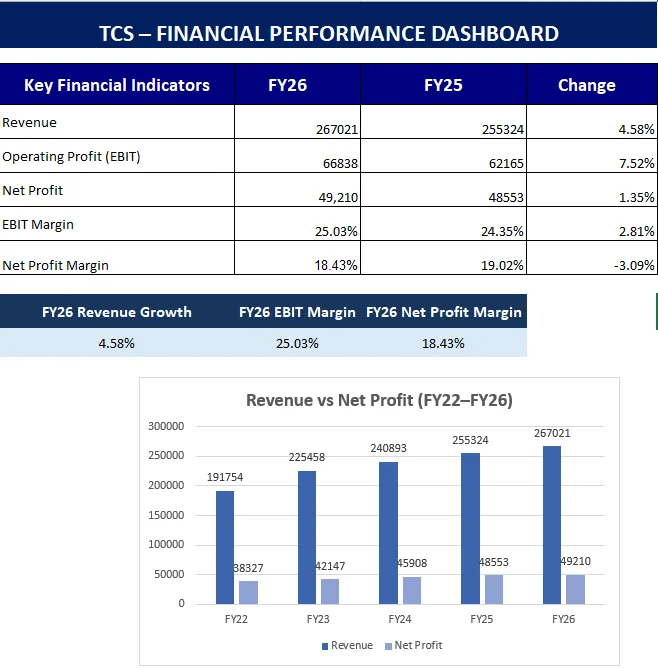
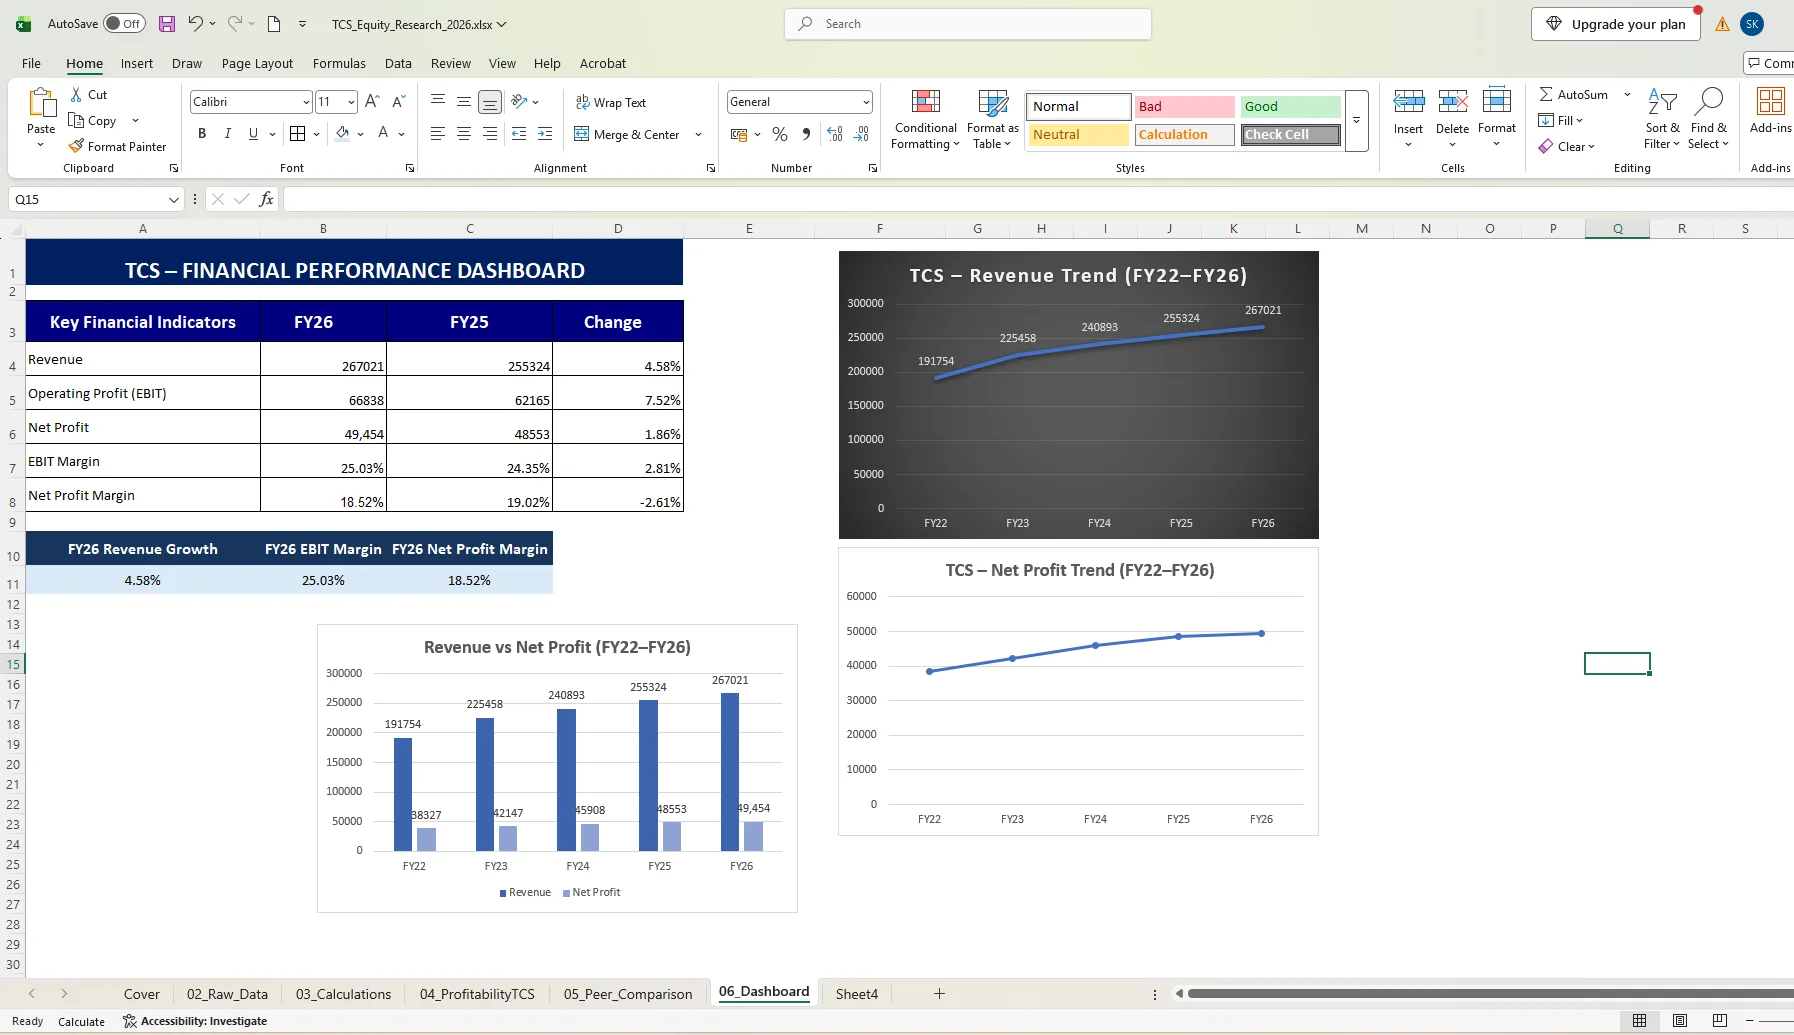
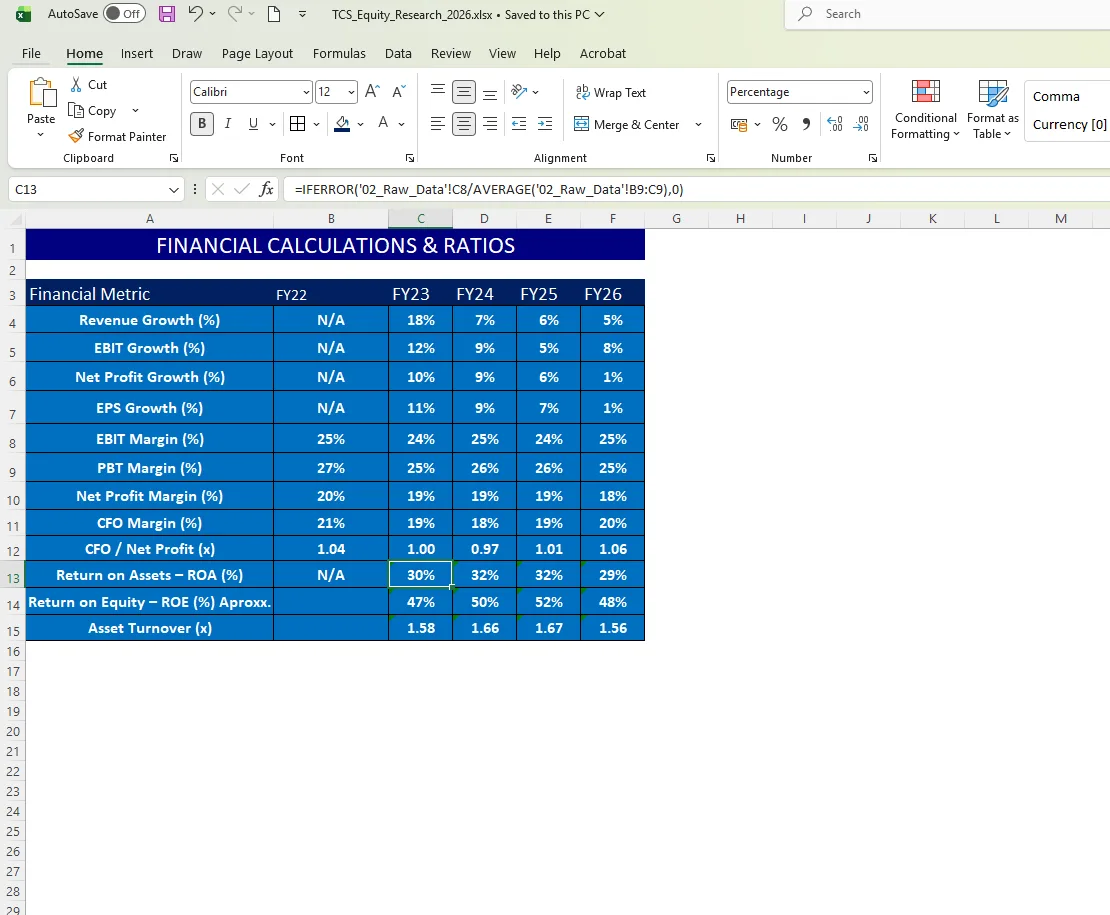
Result Successfully developed a structured Excel-based financial analysis workbook covering five years of TCS financial performance. The final deliverable included: - Financial data and calculations. - Profitability and ratio analysis. - Peer comparison. - Financial dashboard and visualizations.
I have a strong interest in stock market research and understanding company financial performance. To improve my practical financial analysis skills, I created a 5-year equity research project on Tata Consultancy Services (TCS).
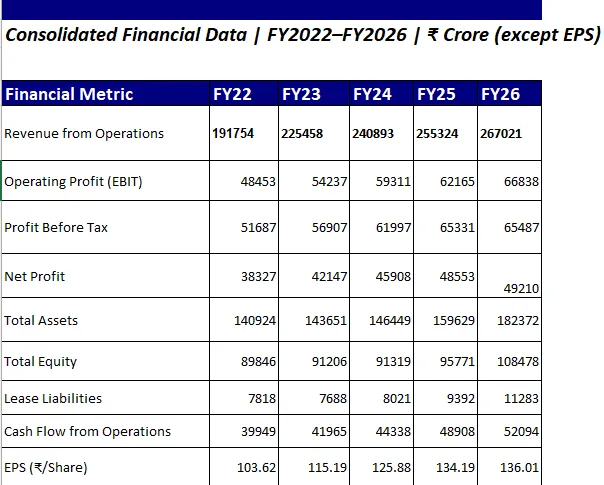
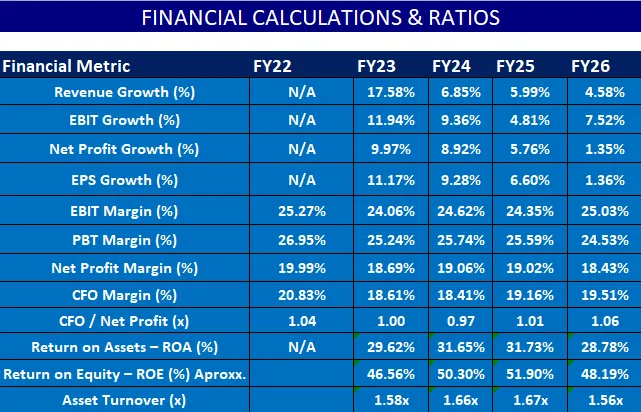
I started by collecting financial information from official annual reports for FY2022 to FY2026. I then organized the data in Microsoft Excel and calculated important financial metrics such as revenue growth, profitability margins, ROE, ROA and cash flow ratios.
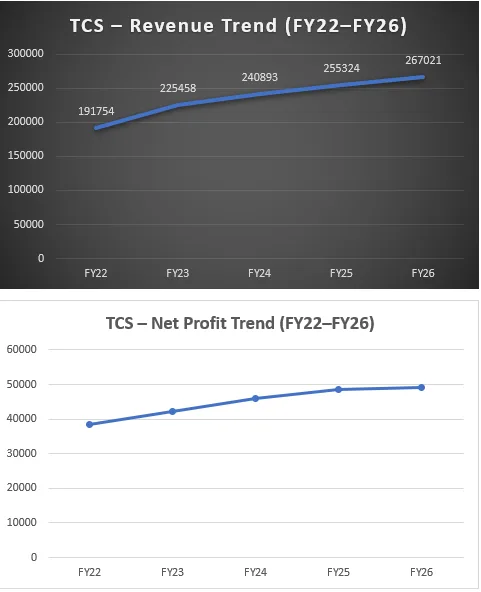
To make the analysis more meaningful, I compared TCS with Infosys, HCLTech and Wipro. I also developed an Excel dashboard with charts and key financial indicators to present the findings clearly.
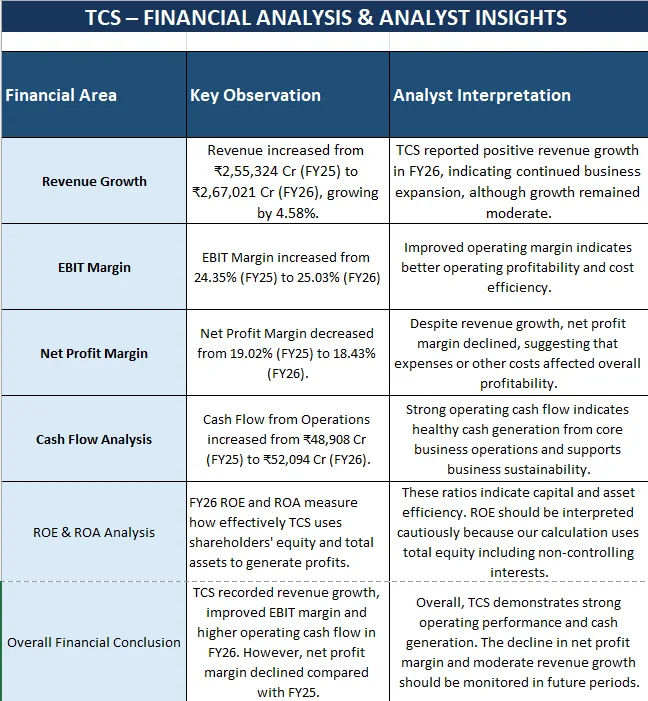
Finally, I prepared analyst insights highlighting the company's financial performance, strengths and areas that require attention.
This project helped me strengthen my practical skills in equity research, financial analysis, Excel reporting and data visualization.
I started by collecting financial information from official annual reports for FY2022 to FY2026. I then organized the data in Microsoft Excel and calculated important financial metrics such as revenue growth, profitability margins, ROE, ROA and cash flow ratios.
To make the analysis more meaningful, I compared TCS with Infosys, HCLTech and Wipro. I also developed an Excel dashboard with charts and key financial indicators to present the findings clearly.
Finally, I prepared analyst insights highlighting the company's financial performance, strengths and areas that require attention.
This project helped me strengthen my practical skills in equity research, financial analysis, Excel reporting and data visualization.